



Net Promoter Score (NPS): how to interpret and improve your score?
5 December 2025

Net Promoter Score (NPS): how to interpret and improve your score?
The Net Promoter Score (NPS) has become one of the most widely used metrics for measuring customer satisfaction and loyalty. Its success is partly due to its simplicity and the standardized question used to calculate it: "Would you recommend our brand to a friend or family member?"
In this article, we'll explain:
- What NPS actually measures and how to calculate it.
- How to interpret your score to draw useful insights.
- How to use it as a compass for your customer experience strategy.
What is Net Promoter Score (NPS)?
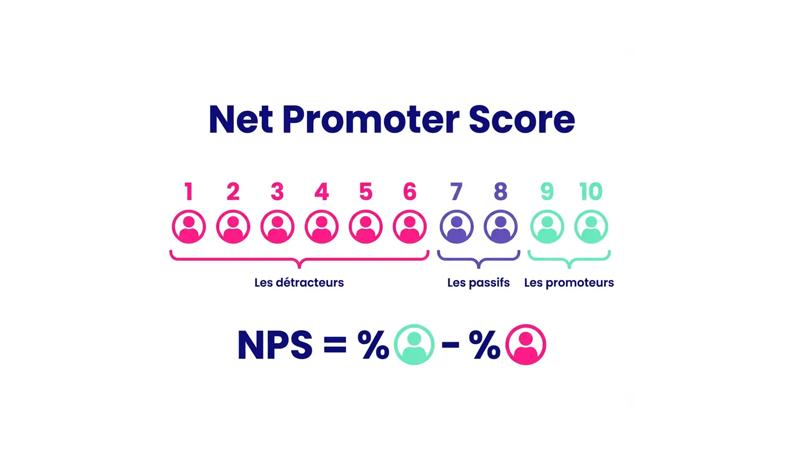
NPS definition
Net Promoter Score (NPS) is a customer satisfaction metric created in 2003 by Fred Reichheld, a consultant at Bain & Company. Its goal is to measure customers' propensity to recommend a brand.
The idea is simple: recommendation is often the most sincere expression of satisfaction. If a customer recommends you, it means they're convinced, loyal, and engaged enough to speak positively about you to those around them.
NPS is based on a single question that has become famous:
"How likely are you to recommend \[our brand / our product\] to a friend or colleague?"
How to calculate NPS
When you ask your customers the NPS question, they're invited to respond on a scale from 0 to 10.
Their rating allows you to classify them into three categories:
- Promoters (scores 9 to 10): your most satisfied customers, ready to actively recommend you.
- Passives (7 to 8): customers who are generally satisfied but neutral, who won't spontaneously recommend or criticize you.
- Detractors (scores 0 to 6): dissatisfied customers or those likely to share a negative experience.
The NPS score is calculated using the following formula:
NPS = % of promoters – % of detractors
The final score ranges from –100 (if all your customers are detractors) to +100 (if all are promoters). The more positive your score, the more loyal, engaged, and likely to recommend your customer base is.
An example: out of 1,000 responses, you get 600 promoters, 250 passives, and 150 detractors.
Your NPS is therefore: 60% – 15% = +45.
What NPS really measures
NPS isn't limited to evaluating one-time satisfaction. It primarily measures emotional loyalty, meaning the strength of the bond between you and your customers.
Your brand can offer an excellent product and still have a low NPS if the experience (customer service, delivery times, communication, customer relations) doesn't meet expectations.
This is what makes NPS a cross-functional metric, useful for all teams: marketing, customer service, product, executive management. You can use it to measure a specific moment in the journey (after a purchase, a call, a customer service contact) or to evaluate the overall quality of your customer relationship.
Why NPS has become a customer experience standard?
In twenty years, NPS has gone from being an experimental metric to a global benchmark for measuring customer loyalty. Companies like Apple, Airbnb, Amazon, and BNP Paribas rely on it to manage satisfaction at scale.
If you see it everywhere today, it's because it addresses two essential needs: simplicity and comparability.
Source: Comparably
1 - A simple but universal metric
NPS has been wildly successful because it's extremely simple to understand and use. One question, one scale from 0 to 10, and a very clear calculation formula.
This simplicity doesn't mean the metric is superficial—quite the opposite. By focusing on recommendation, NPS measures a key dimension of your customer relationship: trust.
Where metrics like CSAT evaluate one-time satisfaction or CES measures the ease of a journey, NPS captures, as we've seen, something deeper: emotional loyalty, the overall perception of your brand, and your ability to create an experience that leaves a positive mark.
To go further, discover the 10 levers of customer loyalty.
2 - A shared standard that enables comparison
NPS's success ultimately comes from...its success, from the fact that it has become a common language for all businesses. Because it's based on a single method, it allows you to compare your performance to that of your industry.
An NPS of +40 in tourism, for example, doesn't mean the same thing as a +40 in banking. You can find industry benchmarks online that allow companies to position their NPS score relative to the market average. We particularly recommend this one.
This comparative dimension pushes companies to challenge themselves. But be careful: NPS shouldn't become a numbers contest. What matters isn't so much the absolute score as the improvement dynamic and understanding the underlying causes.
How to interpret your Net Promoter Score?
Calculating an NPS score from customer responses is one thing. But knowing what it actually means is another. NPS isn't an absolute metric: it should always be read in context, and its interpretation depends on several factors: industry, target audience, timing of collection, channel...
What your NPS score reveals
An NPS above 0 already means you have more promoters than detractors. That's positive. But the real issue isn't the isolated number: it's the balance between the three categories (promoters, passives, detractors) and the trend you observe over time.
Here's a simple reading guide for interpreting your NPS score:
NPS score < 0: Dominant dissatisfaction, weakened relationship.
NPS score 0 to 30: Mixed base: satisfaction exists, but pain points persist.
NPS score 30 to 50: Solid relationship: your customers are generally loyal and positive.
NPS score 50 to 70: Excellent level of trust, strong propensity to recommend.
NPS score > 70: Exceptional relationship: your customers are true ambassadors.
What you also need to keep in mind is that NPS measures the quality of the relationship, not the quality of the product alone. Your brand can therefore have a good product and a mediocre NPS if its customer service is perceived as slow or impersonal.
Industry variability: the same score doesn't mean the same thing everywhere
An NPS of +20 may seem average at first glance, but in certain industries, it's an excellent performance.
In financial services or telecommunications, where interactions often generate frustration, a positive NPS is already a sign of success. Conversely, in e-commerce or luxury, where expectations are high, a score below +40 often indicates significant room for improvement.
Here are some benchmarks for what constitutes a good NPS by industry:
- Banking / insurance: between +10 and +25.
- Retail / e-commerce: between +30 and +50.
- Tourism / hospitality: often above +50.
- B2B SaaS / digital services: around +40.
The challenge isn't to compare your score to an overall average, but to position it relative to your industry, your market, and your customers.
Common interpretation mistakes
Because it's simple, NPS is also often misunderstood. Here are the traps you absolutely must avoid:
- Comparing scores from different contexts. A post-purchase NPS doesn't measure the same thing as an overall NPS. You don't evaluate a moment in the journey the same way as the relationship as a whole.
- Focusing on the number while forgetting the verbatims. The score tells you what your customers think. The comments explain why. Hence the importance of adding an open-ended follow-up question to the NPS question.
- Trying to artificially "optimize" your score. Changing when you send the survey, filtering respondents, or rewording the question to get a better NPS won't help you. You'll improve the number, not the experience.
The importance of dynamics
NPS isn't a static snapshot, but an evolution curve. What matters is the trajectory: a steady increase of a few points reflects lasting improvement, while sudden variations can signal a loss of consistency in the experience.
Tracking your NPS over time (and by segment) allows you to identify the levers that directly influence satisfaction: product launch, website redesign, new customer relations policy, etc.
NPS as a customer experience management tool
NPS only has value if you make it an action tool. Many organizations still just measure their score, add it to a dashboard, and discuss it in committee once a quarter. But without analysis, perspective, and concrete actions, NPS remains a passive metric.
Its true value appears when you use it to guide your decisions, prioritize your initiatives, and connect customer perception to your business performance.
Track score evolution over time
A good one-time score has limited value. What really matters is your ability to track the trend.
By observing your NPS at regular intervals (this could be monthly, quarterly, or after each key stage of the journey), you can identify:
- Whether your customer relationship is improving or weakening
- Which events caused satisfaction to vary
- Whether your corrective actions produced the expected results.
We also recommend cross-referencing your NPS score with other KPIs. This can generate very valuable insights.
Connect NPS to customer data to enrich your understanding
NPS should never be isolated. Taken alone, it gives you your customers' perception, but not their actual behaviors.
When you connect it to your customer data (purchase history, interactions, contact frequency, marketing engagement, CLV), your understanding changes scale.
With a Customer Engagement Platform like Actito, you can:
- Automatically integrate NPS responses into each customer profile.
- Cross-reference the score with "cold" data (demographics, history) and "hot" data (recent behaviors, ongoing actions).
- Segment your customers according to their score and behaviors.
- Identify breaking points in their journey.
- Spot segments where satisfaction is declining.
- Prioritize levers that have a direct impact on customer perception.
NPS becomes actionable data, a "trigger," just like a click, a purchase, or an abandonment.
Transform measurement into action: close the loop
The "Close the Loop" approach consists of feeding NPS insights back into your journeys to generate immediate impact.
Here's how you can activate it:
- Detractors: contact them quickly, provide a personalized response, identify pain points, and show that you take their feedback seriously.
- Passives: offer them a targeted action, a helpful gesture, personalized communication to strengthen the relationship.
- Promoters: invite them to join an ambassador program, leave a public review, or participate in a testimonial.
With Actito, these scenarios can be automated in real time. A response to an NPS survey then becomes a marketing automation workflow trigger: you adapt your messages, channels, and actions according to the segment (promoter, passive, detractor) directly when the customer expresses their feelings.
Key takeaways
If you should remember one thing about NPS, it's this: this score only has value if it informs your decisions.
It's not a goal in itself, it's much more than a marketing argument, it's above all a signal, an "indicator" (in the strong sense of the term) that shows you where your experience is working, where it's declining, and where you need to focus your efforts.
NPS provides three major insights:
- It reveals the real quality of the relationship you're creating. Behind the scores are behaviors: loyalty, repeat purchases, engagement...NPS helps you understand what your customers perceive about your brand, beyond the product or service.
- It highlights friction points you don't always see. The comments that accompany responses are often weak signals to take very seriously.
- It shows you where to act as a priority. NPS is only useful if you make it a lever and trigger for action.
Your turn!